Flat earthers claim that our planet is flat, despite any physical evidence and simple observation. Should we mock those who deny the obvious? Instead, let’s take the time to explain, and justify, on the basis of physical principles.
We have known for a long (very long) time, that earth is round: Aristotle provided first demonstration for a spherical earth in 4th century BC! By the 16th century, navigators had circled it and if scientific demonstrations were not enough, recent space observation of earth brings quite an easy -visual- proof of it.
Nevertheless, there are still a bunch of people to pretend that it is not. Should we mock them? In particular, as the physicists we are? I tend to think that it is a shortcut we should not take, if it’s not for other reasons, at least because it is not the most efficient way to convince and educate.
So when it comes to explain, again and again, that Shack Hartmann Wavefront Sensors are achromatic, I am very happy to do the same. Again, and again. And as physicist, to bring an explanation backed up by demonstration.
So here it goes.
Context
Shack Hartmann Wavefront sensors as we know them originally comes from an idea of Hartmann, in which a set of pinholes allowed to isolate rays and calculate their direction of propagation. Obviously, no effect of wavelength is questioned in the use of Hartmann masks of holes to reconstruct wavefronts.
Shack then proposed to use lenses instead of holes. As they concentrate light instead of blocking it, it is a much more efficient optical system. Combined with the advent of cameras and modern computers, it made the Shack Hartmann wavefront sensors the reference it is nowadays for wavefront sensing.
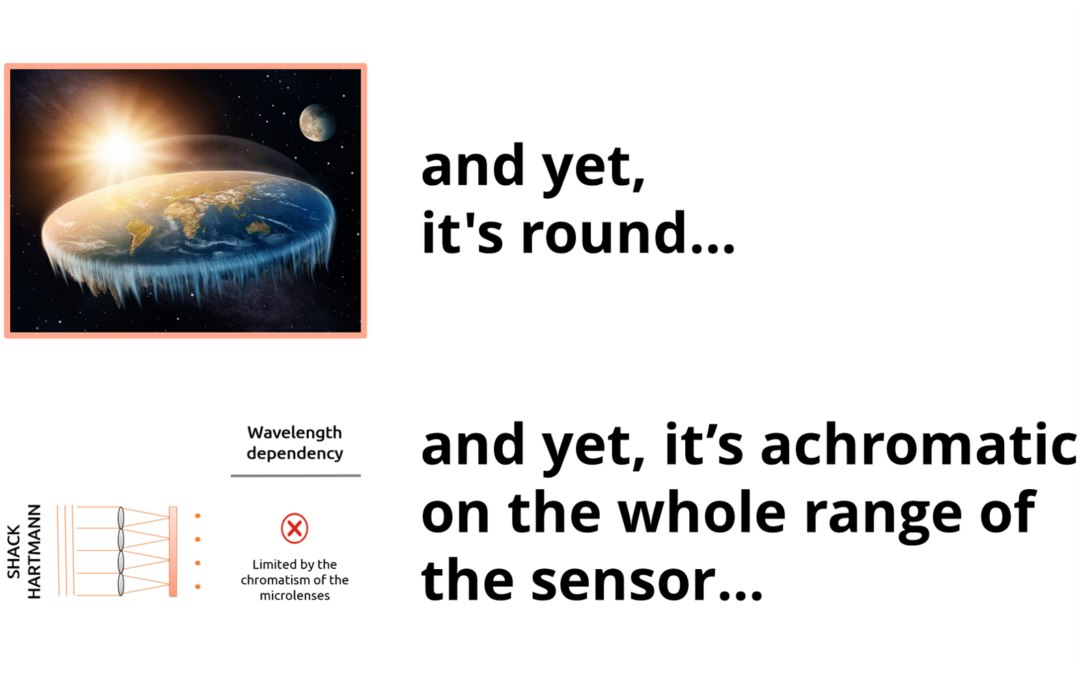
But here’s the thing: lenses are chromatic, hence Shack Hartmann wavefront sensors are limited by chromaticity! But that’s a simplification, and as always, the devil is in the details.
Simulations
So let’s leave faith or conspiracy theories aside and simulate the behavior of the microlenses array of a Shack Hartmann wavefront sensor at different wavelengths (representative of the sensor’s spectral range of use) and for different wavefront slopes (to mimic the sensor’s measurement dynamic of aberrations).

We use Zemax raytrace software to simulate the optical propagation of 3 incoming collimated beams corresponding to incidence angles of 0°, 1° and 3° sampled by a microlens (figure a). The distance between the microlens and the detector (wavefront sensor array of pixels) is optimized at 635nm.
We plot the various PSFs corresponding the centroid focused by the microlens for 4 different wavelengths: 450nm, 635nm, 850nm and 1050nm. (figure b). We can observe that the diameter of the PSFs increases significantly with wavelength, which is not surprising (we know that the diameter of the focal point is linearly proportional to the wavelength link). The visual effect of chromatism cannot be appreciated on the PSFs: 1/ longitudinally: the chromatic focal length of the microlens and the corresponding defocus do not compensate for the change in diameter of the centroid, 2/ laterally: no effect of the defocus on the shape of the PSF and on its symmetry can be appreciated (one could expect that the defocus combined with the lateral displacement of the centroid for high slopes values might affect the intensity distribution of the PSF).
We then plot the Spot Diagram for each slope and for each wavelength, together with the Airy disk (black circle in figure c) which represents the diffraction limit of the microlens at 635nm. All Spot Diagrams and all Spot Diagram variations due to wavelength changes are clearly well below the diffraction limit of the microlens, which represents its best ability to focus light. Also, the fact that for a given slope, all the Spot Diagrams continue to overlap at all wavelengths suggests that the effect of chromatism on lateral position of the centroid, if it exists, is minimal not only in relation with the Airy disk size but also in relation to the size of the pixels (corresponding to the gray grid in figure c).
Analysis
Even if the Spot Diagrams -and the absence of visual variations in PSF intensity distribution for the different slopes at different wavelengths- already tell us that the effect of chromatism is marginal in a design representative of a Shack Hartmann wavefront sensor, we continue the simulation analysis by calculating the barycentric position of each PSF. We then compare this position respect with the position of the PSF at 635nm, wavelength for which the system is optimized, and translate position errors in slope errors (see table below).
| Slope error @635nm [rad] | Slope error @635nm [°] | |||||
| Wavelength (nm) | @0° | @1° | @3° | @0° | @1° | @3° |
| 450 | 0 | 7,5E-07 | 2,3E-06 | 0 | 4,3E-05 | 1,3E-04 |
| 635 | 0 | 0 | 0 | 0 | 0 | 0 |
| 850 | 0 | -4,0E-07 | -1,2E-06 | 0 | -2,3E-05 | -6,9E-05 |
| 1050 | 0 | -6,0E-07 | -1,9E-06 | 0 | -3,4E-05 | -1,1E-04 |
We can observe and quantify the error in slope measurements when combining high slopes values with spanning the spectral range of the sensor. Absolute value is found to be approx. 2urad at the limits of the spectral range, 450nm and 1050nm. Relative value is as small as approx. 0.004%, in the worst case.
Conclusion
We put a scale on the effect of chromatism even in presence of huge wavefront dynamic and demonstrated that their impact on centroid aspect and centroid lateral position is minimal. We can claim then Shack Hartmann wavefront sensors are achromatic on their whole spectral range such as our HASO4 BROADBAND.
We are happy to discuss how they suit your needs. Reach us at contact@imagine-optic.com .